


 Jonathan
एआई स्केलिंग कानूनों का दृश्य प्रतिनिधित्व विस्तार से समझाया गया
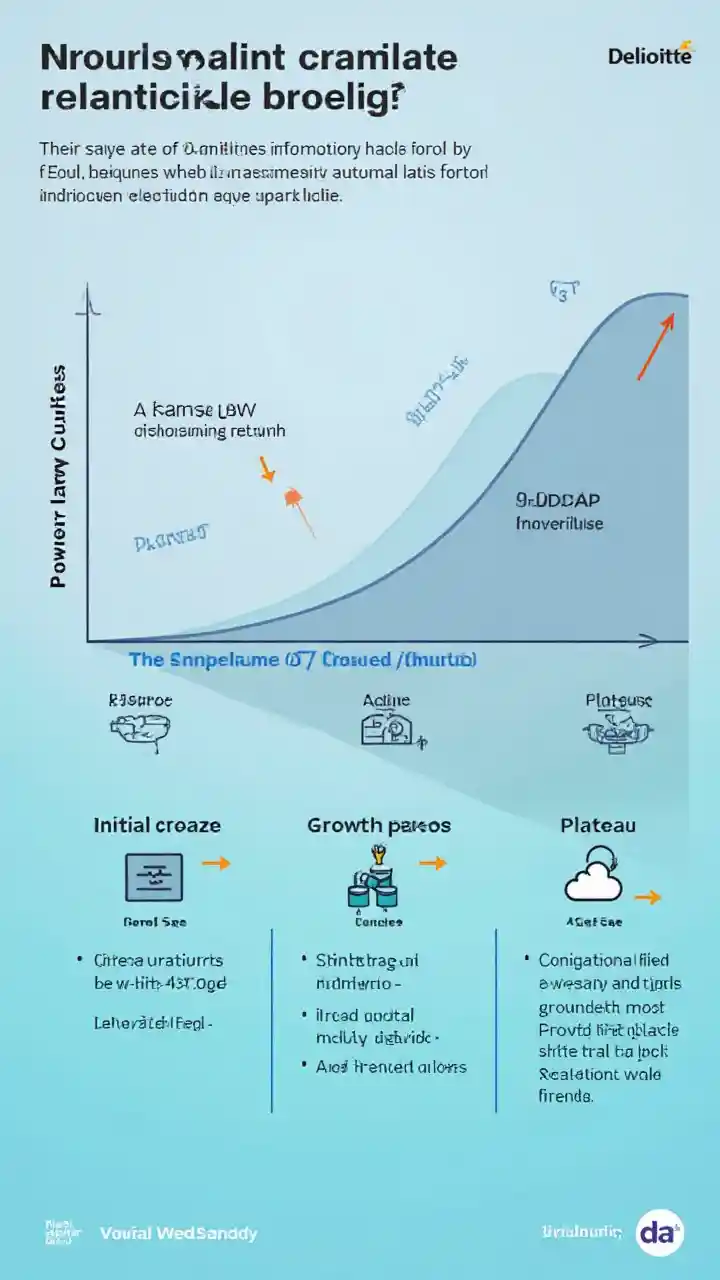
Title: "The Journey of AI Scaling" Description: Create a visually engaging graphic that illustrates the concept of AI scaling laws. The image should include the following elements: Background: A gradient background transitioning from a lighter shade at the top to a darker shade at the bottom, symbolizing the depth and complexity of AI. Main Element: A graph with two curves: Power-Law Curve: A smooth, upward-sloping curve that gradually flattens out, representing diminishing returns. S-Curve: Another curve that starts steep, then flattens in the middle, and slightly rises again, representing the S-curve hypothesis. Axes: X-Axis: Labeled "Resources (Model Size, Data, Compute)" Y-Axis: Labeled "Performance" Annotations: Initial Phase: Highlight the steep part of both curves with a label "Initial Phase: Rapid Growth". Growth Phase: Highlight the middle part with a label "Growth Phase: Slowing Improvements". Plateau Phase: Highlight the flattening part with a label "Plateau Phase: Minimal Gains". Icons/Illustrations: Small icons representing "Model Size" (e.g., a neural network), "Data" (e.g., a database), and "Compute" (e.g., a cloud server) along the X-axis. Business-related icons (e.g., a lightbulb for innovation, a dollar sign for investment) near the annotations to indicate business implications. Title Text: At the top of the image, include the title "Unlocking AI’s Potential: The Power of Scaling Laws". Branding: Subtly include the Deloitte logo in the bottom corner to maintain brand consistency.